Programming Projects


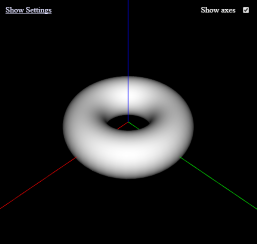
This browser application renders 3D graphs of equations that the user enters. It consists of several modes, each made to plot a certain type of graph. It is written in JavaScript and WebGL, allowing it to be run in the browser. The supported graphs are listed below:
To get started, click the link below. I recommend clicking some of the "Examples" links for samples of how to use the program, since a tutorial has not yet been written. The syntax is similar to the Java version, so reading its tutorial can help.

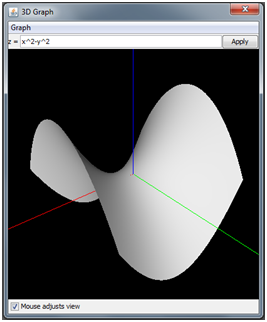
This program renders 2D and 3D graphs of equations that the user enters. It consists of several modes, each made to plot a certain type of graph. The program can plot the following graphs:
Direct download
See all versions (GitHub)
Source (GitHub)
Tutorial